|
Back to Page 1
Click on charts with blue boarders for a larger image.
A screen shot of our MktChart application is shown below.
Note: Hawaii Time Zone.
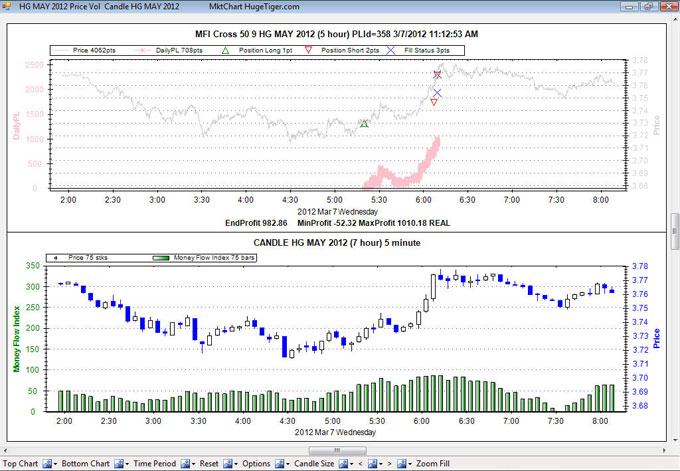
MktChart displays data collected from LIVE runs or SIMulated runs. Here, we are using
5 minute candlesticks. The MFI Cross 50 9, strategy is: Money Flow Index
cross 50 upwards to go long and vise versa. Use 9 time segments for the running
averages. On this run we also used PSP Profit $1000, Stop Loss $275, Protect
$800 we cover and quit for the day if total profit exceeds $1000 or drops to a
loss exceeding $275. If profit exceeds
$800 we enter a Trailing stop loss order at $400. On this day the profit
exceeded $1000 so trailing stop is canceled and profit taker LMT order is
entered and quickly filled.
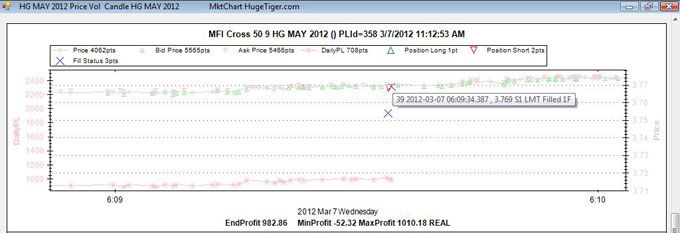
The MktChart Application uses a slightly modified version of the popular
ZedGraph Library. Above we have turned on Bid, Ask, and Last price symbols and zoomed in to see
detail. On mouse over additional information is given about each point. Here,
mouse over is on the Fill Status.
We have analysed many variations of trading using the MFI indicator, the
Fisher indicator and other indicators. The MFI indicator is driven by both price
and volume over a series of candle sticks. The Fisher only uses the last price
of a series of candle sticks.
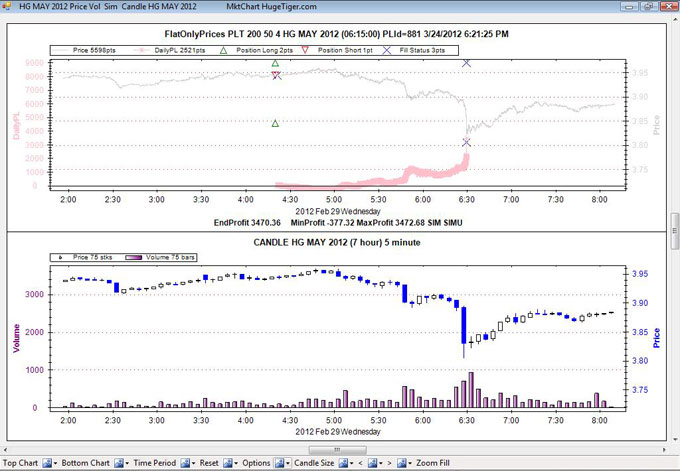
FlatOnlyPrices is the trade strategy name. We look for 4
consecutive candle sticks with
small slope and little volatility, then we submit our orders and wait for a
break out. The direction of the trade is based upon the slope. We enter the
trade with a STP order, limit losses with a STP order and have a profit taker
with a LMT order. PLT 200 50 are parameters of the trade strategy. PLT means
Profit, Loss, Ticks. We enter the profit taker LMT order 200 ticks below the
current price, the STOP Loss 50 ticks above the current price. For HG (Copper
25000 lbs) the min tick size is 0.0005 which is a factor in calculating our
order prices. The entry STP order is always 3 ticks from the current price. The
entry order is a parent order and the profit and loss orders are both child
orders so they won't get filled unless the parent order is filled first. As you
can see, when a child order is filled, its sibling is canceled.
Psychology, of FlatOnlyPrices is wait for a lull in trading,
possibly waiting for a news event. Hopefully, a trend emerges and we catch it.
Simulation runs use class GenOrderStatusSIM which simulates order status
updates that usually TWS would generate. Thus, enabling us to run simulations
without being connected to TWS. We can simulate LMT, STP and TRAIL orders,
including parent and child rules such as: When the child filled then sibling is canceled.
When the parent
is canceled then children are canceled. Children can be cancelled independently of
the parent.
The simulation loop calls method SimCheckForFills
on every bid, ask, or price tick. All status events we create will be either
PreSubmitted,
Submitted, Filled, or
Cancelled. TWS sometimes generates multiple
identical order status events which complicates our order status processing. We
had to detect them and then skip them. In simulations we do not mimic this
behavior.
A fair amount of effort was put into tweaking GenOrderStatusSIM
so it aligns with TWS in terms of price, timing, and fill size. The
resulting P & L comparison between LIVE and SIM is sometimes spot on, and most
of the time pretty close. As a caveat, we choose our trading session to be
during the daily time span of best liquidity. All positions are covered at the
end of this time span.
During LIVE runs we collect bid, ask, price, volume, bid size, and ask size
ticks and other events. In a simulation run we use bid, ask, price, and volume ticks.
Not sure what to do with bid size and ask size, we can plot them, maybe they
will be useful later.
A simulation run is processed in around six seconds. A recent HG run had
33.7K ticks and a recent ES run had 45.1K ticks. That is a lot of data. Luckily,
computers are very fast.
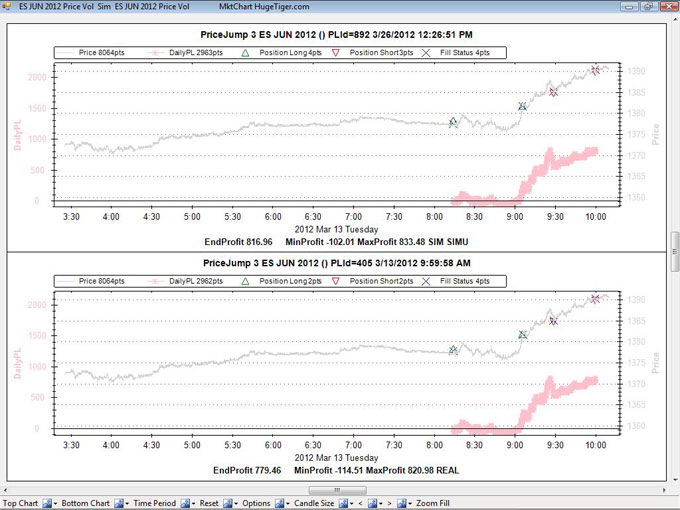
PriceJump 3 is a tick
based strategy. Each price tick is compared to the old price tick. when the
price jumps by 3 or more ticks a LMT order is entered 1 tick beyond the last
price. On jump up, we go long and vice versa. On subsequent price jumps we add
or subtract to the position. The position sequence for this run is 0, 1, 2, 1,
0. For ES, positions are covered at 10:00 AM Hawaii time in the winter which is
4:00 PM EST.
Psychology of PriceJump is a news
event causes large orders which consume all the current sell orders, since the sellers have
been exhausted the price jumps up, we enter the market immediately and hope the
trend continues and vice versa for jump down.
MktChart when run in the compare mode shows the latest simulation run and its corresponding LIVE run. The charts look almost identical. However,
The EndProfits differ by $37.50 because, the
simulation run computed better fills, by one tick, at 8:14, 9:30, and
10:00. If you look very closely on the larger image, you can see the difference.
Please share constructive comments via the Facebook page, email or however
you prefer.
 Official Facebook Page
Back to Page 1
|
)
)
)
)