Evaluation of Technical Trading methods
Upon examination and extensive testing of some technical trading methods, it appears
that most methods suffer from a large percentage of false positives. The easy way
to sort though this mess is to show a P & L (Profit & Loss) curve along
with an OHLC price chart with Long, Short, and Cover symbols.
Click on charts with blue boarders for a larger image.
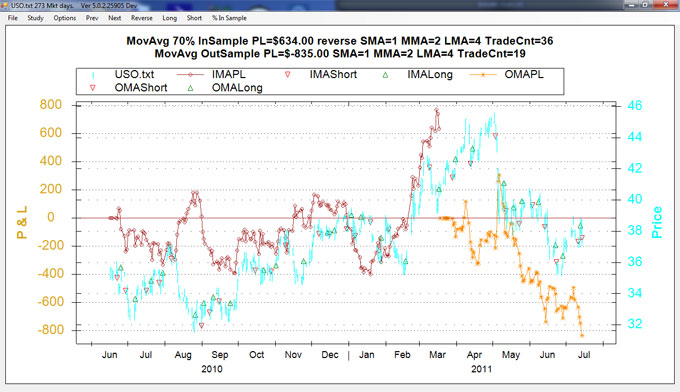
From EODTT: This chart shows a profit of $634.00 for the in sample segment of the
chart where we picked the three parameters with the benefit of hindsight. In the
next segment using the same parameters results in a loss of $835.00. Not very impressive,
and unfortunately typical. The out of sample performance is fairly random.
Chart generation sequence. Run End of Day Technical Trader (EODTT) software, select
market price data file (USO.txt) Any daily market data file downloaded from yahoo.com
will do. Select the Study (MovAvg), select % in Sample (70%). Note, above
plot total P & L (TPL) has been selected.
EODTT calculates the end of the in sample period profit for many combinations of
the three moving averages, short moving average (SMA), medium moving average (MMA),
and long moving average (LMA) and makes note of the parameters generating the highest
profit.
A long signal is generated when SMA>MMA>LMA, a short signal is generated when
SMA<MMA<LMA. The are also three modes (reverse, long, short) for the MovAvg
study. This chart had been run in the "reverse" mode.
In reverse mode, we are always in the market and we reverse our position when a
signal occurs. In long mode we only go long on a long signal and we cover on a short
signal. In short mode, vice versa.
So far I have mostly implemented the following technical trading studies,
Mono, Fisher, FishConfirm, MovAvg, ADX, Week_Segements, Regression, and MaxProfitH.
EWaveTrade
is a tool to aid in the process of
analyzing market price data using
the Elliot Wave Theory, particularly
applying the concepts and principles
developed by Glenn Neely. It is
claimed that the book "Mastering Elliott Wave" by Glen Neely is recommended
for both potential developers and users of this software."
I started out by downloading, compiling and testing the EWaveTrade software
Version 1.0. It worked nicely with the sample data files provided. When I tried
to use some more modern daily market data downloaded from Yahoo there were some
minor data conversion errors which were easy to fix with some minor changes to the
software.
From reading "Mastering Elliott Wave" by Glen Neely I gained a slightly
better understanding of reading the charts generated by the EWaveTrade software.
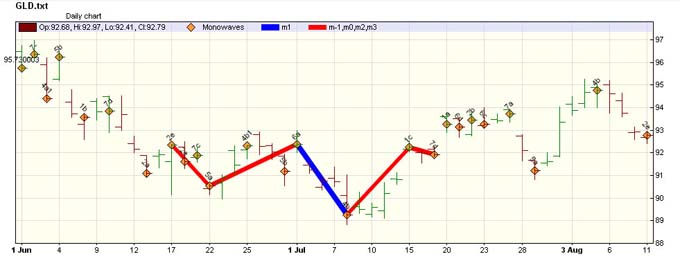
From EWaveTrade: Monowaves are denoted by the orange diamond symbols and use hindsight
of one market day.
Monowaves are defined as the beginning and end of a continuous trend where in the
long case each close is higher than the previous and in the short case vice versa.
Please note that the end of a monowave cannot be determined until one market day
after the end of a continuous trend.
Most of the time the five Elliott waves in red and blue simply connect each of the
monowaves. However, in the case above EWaves m-1 and m0, we see that two monowaves
are skipped above giving the illusion that EWaves show the larger trend turning
points. Unfortunately, the skipping of the monowaves only occurs in EWaves m-1 and
m0 never in EWave m3, and therefore too late to trade on. In other words the skipping
is done with the benefit of hindsight.
To verify this behavior, I modified the EWaveTrade software such that it did not
read in the entire market data at first and I added a button to read in one more
day each time the button was pressed. Then I could see the five waves change each
time another market day was added. The Elliott wave preformed no better than monowaves
which themselves use hindsight of one market day.
I do admit my interpretation on how to profitably trade Elliott wave theory may
be completely wrong.
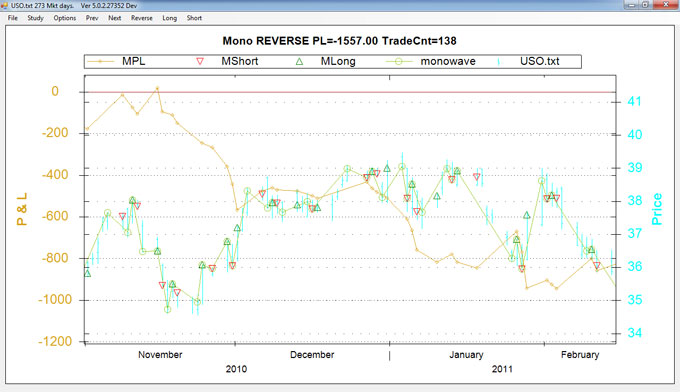
From EODTT: Trading as soon as the monowaves are defined, which is one day after
the trend changes.
Note for clarity, we zoomed into a section where the P&L and price curves are
near.
Trading based on monowaves resulted in poor performance for our test set.
Our test set consisted of GLD, SLV, SPY, and USO using the data range 2008-6-16
to 2011-7-14. Furthermore, GLD, SLV, and USO were each split into three segments.
Our test set was GLD1.txt, GLD2.txt, GLD3.txt, GLDAll.txt, SLV1.txt, SLV2.txt, SLV3.txt,
SLVAll.txt, SPYAll.txt, USO1.txt, USO2.txt, USO3.txt, USOAll.txt. Note, above
plot closed P & L (CPL) has been selected.
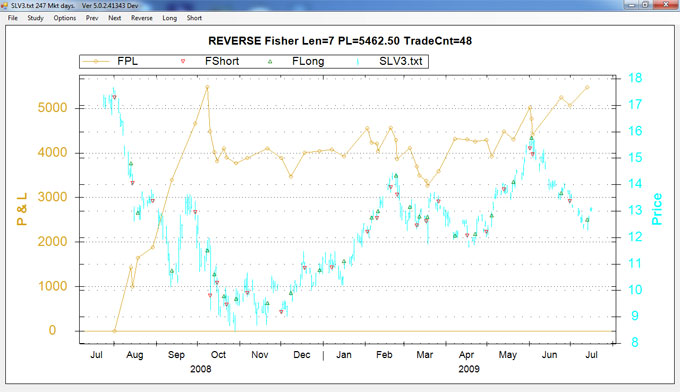
From EODTT: The fisher indicator has a "Length" parameter like a moving average.
The longer the length the fewer the trades. With hindsight we choose a profitable
"Length", Using the "Length" for the next two market data segments
results in less impressive performance. Closed P & L selected.
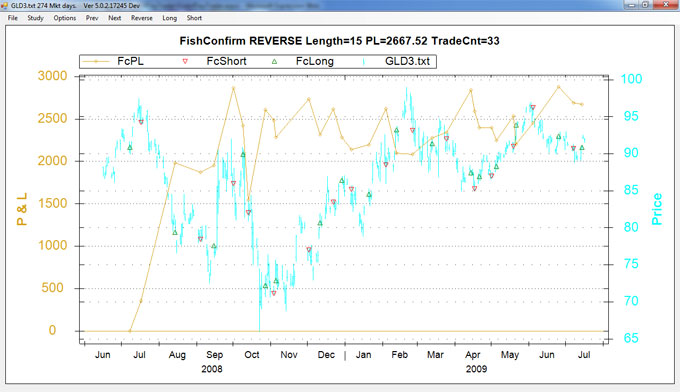
From EODTT: Fish Confirm is similar to the Fisher indicator, except that it requires
two consecutive consistent trend change indicators before entering a trade. Closed
P & L selected.
With hindsight for the "Length" we have good performance. Performance
with Length 15 stays good for GLD2.txt with P & L of $2757. and for GLD1.txt
of ($504). and GLDAll.txt with $4400.
Fish Confirm also preformed well with SLV3 with hindsight we choose "Length"
as 20. Giving results SLV3 P & L $7714, SLV2 ($2636), SLV1 $8218 and SLVAll
$15896.
USO3 with hindsight we choose "Length" as 4. P & L USO3 $4104, USO2
($3577), USO1 ($154) USOAll $2323. Draw your own conclusions.
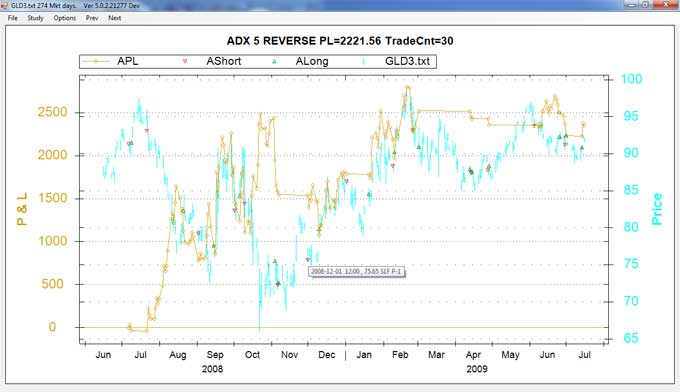
From EODTT: ADX, computes +DI, -DI and ADX, we go long when ADX > 25 and +DI
> -DI, we go short when ADX > 25 and +DI < -DI, we cover when ADX <
25. There is also a "Length" parameter. Total P & L selected.
With hindsight for the "Length" of 5 we have good performance for GLD3
with P & L of $2221. GLD2 ($1570) GLD1 ($419) and GLDAll
$187.
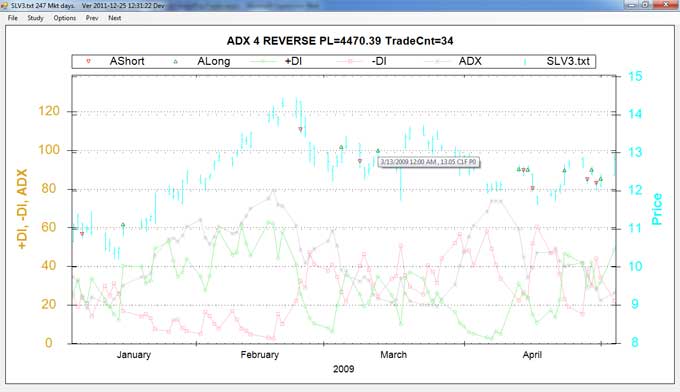
From EODTT: For ADX study P & L plot turned off and indicator plots appear.
We zoom into a section where ADX drops below 25 and see that a cover is executed
on March 13, 2009, Price 13.05, Cover 1 Fill, Position 0, which is displayed via
mouse over "3/13/2009 , 13.05 C1F P0".
With hindsight for the "Length" of 4 we have good performance for SLV3
with P & L of $4470. SLV2 ($2568) SLV1 $7198. and SLVAll
$11460.
Go on to Part 2
Buy End
of Day Technical Trader (EODTT) software.
Official Facebook Page
|
)
)
)
)
)
)
)