Evaluation of Technical Trading methods
Part 2 Go to Part
1
Click on charts with blue boarders for a larger image.
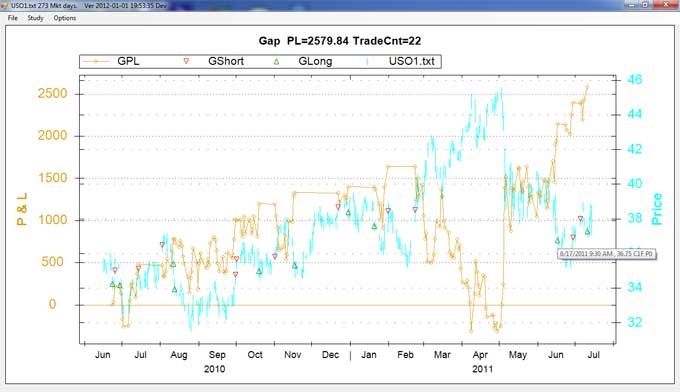
From EODTT: Gap study enters a trade when a gap occurs. We enter very near the close
of the day. We cover when the gap is closed, via limit order. As shown our limit
order was filled at the open at a better price than expected. This is not atypical.
The total P & L is shown above.
You may have observed that most of the time gaps close. Note that the closed P&
L is better than the previous closed P & L every time on this chart. On Feb
22, 2011 with a total P & L of $1635. a gap up occurs. Before we close this
gap we have a draw down all the way to ($314.) twice. But if we hang in there
till June 17, 2011. Our total P & L rises to $2138.
Whereas, for test set SPYAll on June 20, 2008 the first gap down occurs and we go
long waiting for the gap to close. On March 9, 2009 we hit a P& L of ($4833).
From there the gap is finally closed on Feb 14, 2011 for a gain of $136.
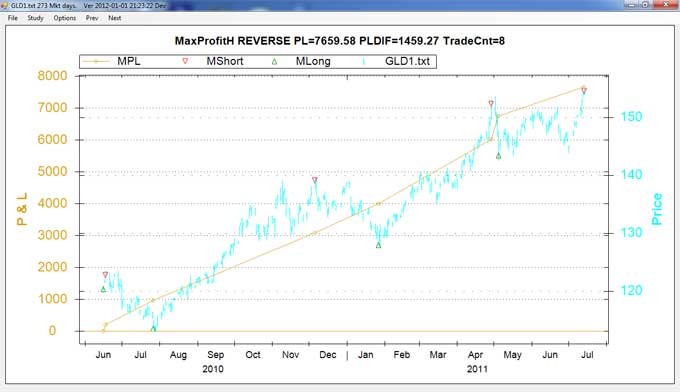
From EODTT: I got tired of modeling poor performing techniques. So I implemented
Max Profit Hindsight. This shows the best 8 trades you can make with the benefit
of hindsight. PLDIF shows the increase in P & L from 6 trades to 8 trades. The
Closed P & L is shown above.
Deciding the first 2 trades is easy they always occur on the first and last days
of the test set. Since this is a rising market we go long and then cover on the
last day. When "Next" is pressed, we look at the segment of days between
the pair of previous trades and pick a pair that gives us the maximum increase in
profit. On each subsequent "Next" press we add another pair of trades.
With each internal trade we "REVERSE" our position.
Another technique we tried was using regression to derive higher order polynomials
to fit the in sample test data. A small standard deviation was usually found between
an order of 9 and 11 for our shorter test sets with a good fit. However, higher
order polynomials soon diverge greatly outside of the range for which they were
derived. Therefore, regression appears to have no predictive value.
End of Day Technical Trader (EODTT) software aids you to evaluate various technical
trading methods . Choose a Study, parameters and a set of Market data and see
graphically exactly where trades occur in price and time along with a graph of the
profit and loss.
Buy End
of Day Technical Trader (EODTT) software.
Software Details.
Official Facebook Page
|
)
)